Skip to content

Prediction intervals

Libraries

1
2
3
4
5
6
7
8
9
# Libraries
# ==============================================================================
import numpy as np
import pandas as pd
import matplotlib.pyplot as plt

from skforecast.ForecasterAutoreg import ForecasterAutoreg
from sklearn.linear_model import Ridge
from sklearn.metrics import mean_squared_error

Data

 1
 2
 3
 4
 5
 6
 7
 8
 9
10
11
12
13
14
15
16
17
18
19
20
21
22
23
24
25
26
# Download data
# ==============================================================================
url = ('https://raw.githubusercontent.com/JoaquinAmatRodrigo/skforecast/master/data/h2o.csv')
data = pd.read_csv(url, sep=',')

# Data preprocessing
# ==============================================================================
data['fecha'] = pd.to_datetime(data['fecha'], format='%Y/%m/%d')
data = data.set_index('fecha')
data = data.rename(columns={'x': 'y'})
data = data.asfreq('MS')
data = data['y']
data = data.sort_index()

# Split train-test
# ==============================================================================
steps = 36
data_train = data[:-steps]
data_test  = data[-steps:]

# Plot
# ==============================================================================
fig, ax=plt.subplots(figsize=(9, 4))
data_train.plot(ax=ax, label='train')
data_test.plot(ax=ax, label='test')
ax.legend();

Create and train forecaster

1
2
3
4
5
6
7
8
9
# Create and fit forecaster
# ==============================================================================
forecaster = ForecasterAutoreg(
                    regressor = Ridge(),
                    lags      = 15
                )

forecaster.fit(y=data_train)
forecaster
1
2
3
4
5
=======================ForecasterAutoreg=======================
Regressor: Ridge()
Lags: [ 1  2  3  4  5  6  7  8  9 10 11 12 13 14 15]
Exogenous variable: False
Parameters: {'alpha': 1.0, 'copy_X': True, 'fit_intercept': True, 'max_iter': None, 'normalize': False, 'random_state': None, 'solver': 'auto', 'tol': 0.001}

Prediction

 1
 2
 3
 4
 5
 6
 7
 8
 9
10
11
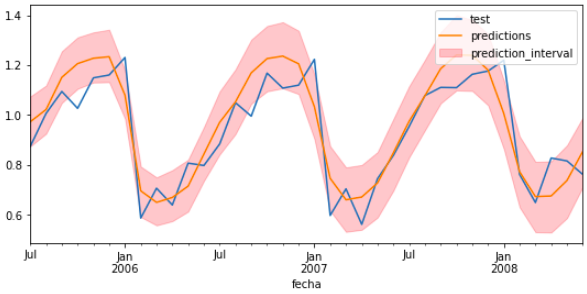
# Prediction intervals
# ==============================================================================
predictions = forecaster.predict_interval(
                    steps    = steps,
                    interval = [5, 95],
                    n_boot   = 1000
              )

# Add datetime index to predictions
predictions = pd.DataFrame(data=predictions, index=data_test.index)
predictions.head(4)
1
2
3
4
5
6
                0           1           2
fecha           
2005-07-01  0.973131    0.874545    1.074531
2005-08-01  1.022154    0.925574    1.118590
2005-09-01  1.151334    1.048968    1.255996
2005-10-01  1.206401    1.105658    1.311676
 1
 2
 3
 4
 5
 6
 7
 8
 9
10
11
12
13
14
# Plot predictions and interval
# ==============================================================================
fig, ax=plt.subplots(figsize=(9, 4))
data_test.plot(ax=ax, label='test')
predictions.iloc[:, 0].plot(ax=ax, label='predictions')
ax.fill_between(
    predictions.index,
    predictions.iloc[:, 1],
    predictions.iloc[:, 2],
    color='red',
    alpha=0.2,
    label='prediction_interval'
)
ax.legend(loc='upper right');