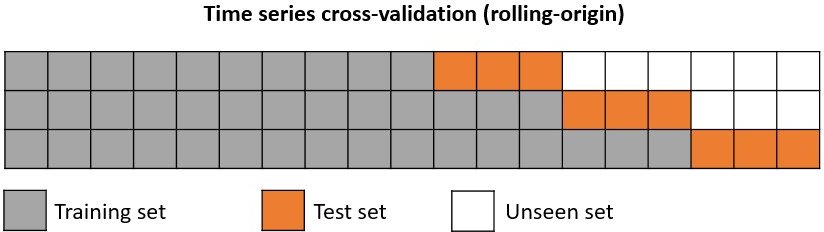
The model is trained before making the predictions, in this way, the model use all the information available so far. It is a variation of the standar cross-validation but, instead of making a random distribution of the observations, the training set is increased sequentially, maintaining the temporal order of the data.
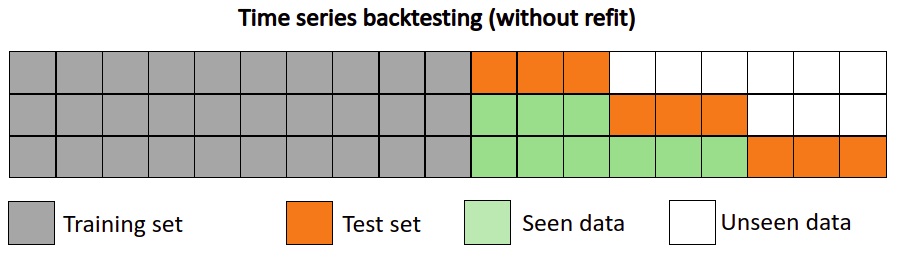
Backtesting
It is a similar strategy to that of time series cross-validation but without retraining. After an initial train, the model is used sequentially without updating it and following the temporal order of the data. This strategy has the advantage of being much faster than time series cross-validation since the model is only trained once. However, the model does not incorporate the latest information available so it may lose predictive capacity over time.
Number of folds: 11
Since `allow_incomplete_fold=True`, last fold only includes 2 observations instead of 10.
Incomplete folds with few observations could overestimate or  underestimate validation metrics.
array([0.00422291, 0.00634336, 0.01092581, 0.00483358, 0.00746501,
       0.0048392 , 0.01333912, 0.00597068, 0.00616372, 0.00881862,
       0.00677257])
# Backtest forecaster# ==============================================================================n_backtest=36*3+1# Last 3 months are used for backtestdata_train=data[:-n_backtest]data_test=data[-n_backtest:]forecaster=ForecasterAutoreg(regressor=Ridge(),lags=15)metric,predictions_backtest=backtesting_forecaster(forecaster=forecaster,y=data,initial_train_size=len(data_train),steps=10,metric='mean_squared_error',verbose=True)print(f"Error de backtest: {metric}")
123456
Number of observations used for training: 95
Number of observations used for testing: 109
    Number of folds: 11
    Number of steps per fold: 10
    Last fold only includes 9 observations
 Error de backtest: [0.01823166]
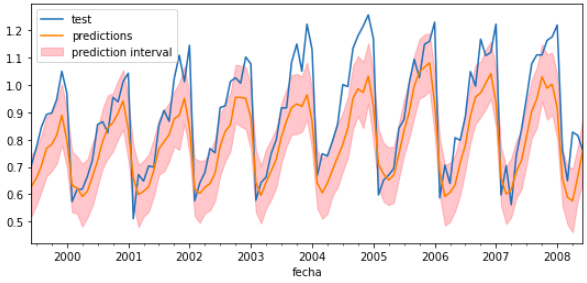
# Backtest forecaster# ==============================================================================n_backtest=36*3+1# Last 3 months are used for backtestdata_train=data[:-n_backtest]data_test=data[-n_backtest:]forecaster=ForecasterAutoreg(regressor=Ridge(),lags=15)metric,predictions_backtest=backtesting_forecaster_intervals(forecaster=forecaster,y=data,initial_train_size=len(data_train),steps=10,metric='mean_squared_error',interval=[5,95],n_boot=500,verbose=True)print(f"Error de backtest: {metric}")
123456
Number of observations used for training: 95
Number of observations used for testing: 109
    Number of folds: 11
    Number of steps per fold: 10
    Last fold only includes 9 observations
 Error de backtest: [0.01823166]